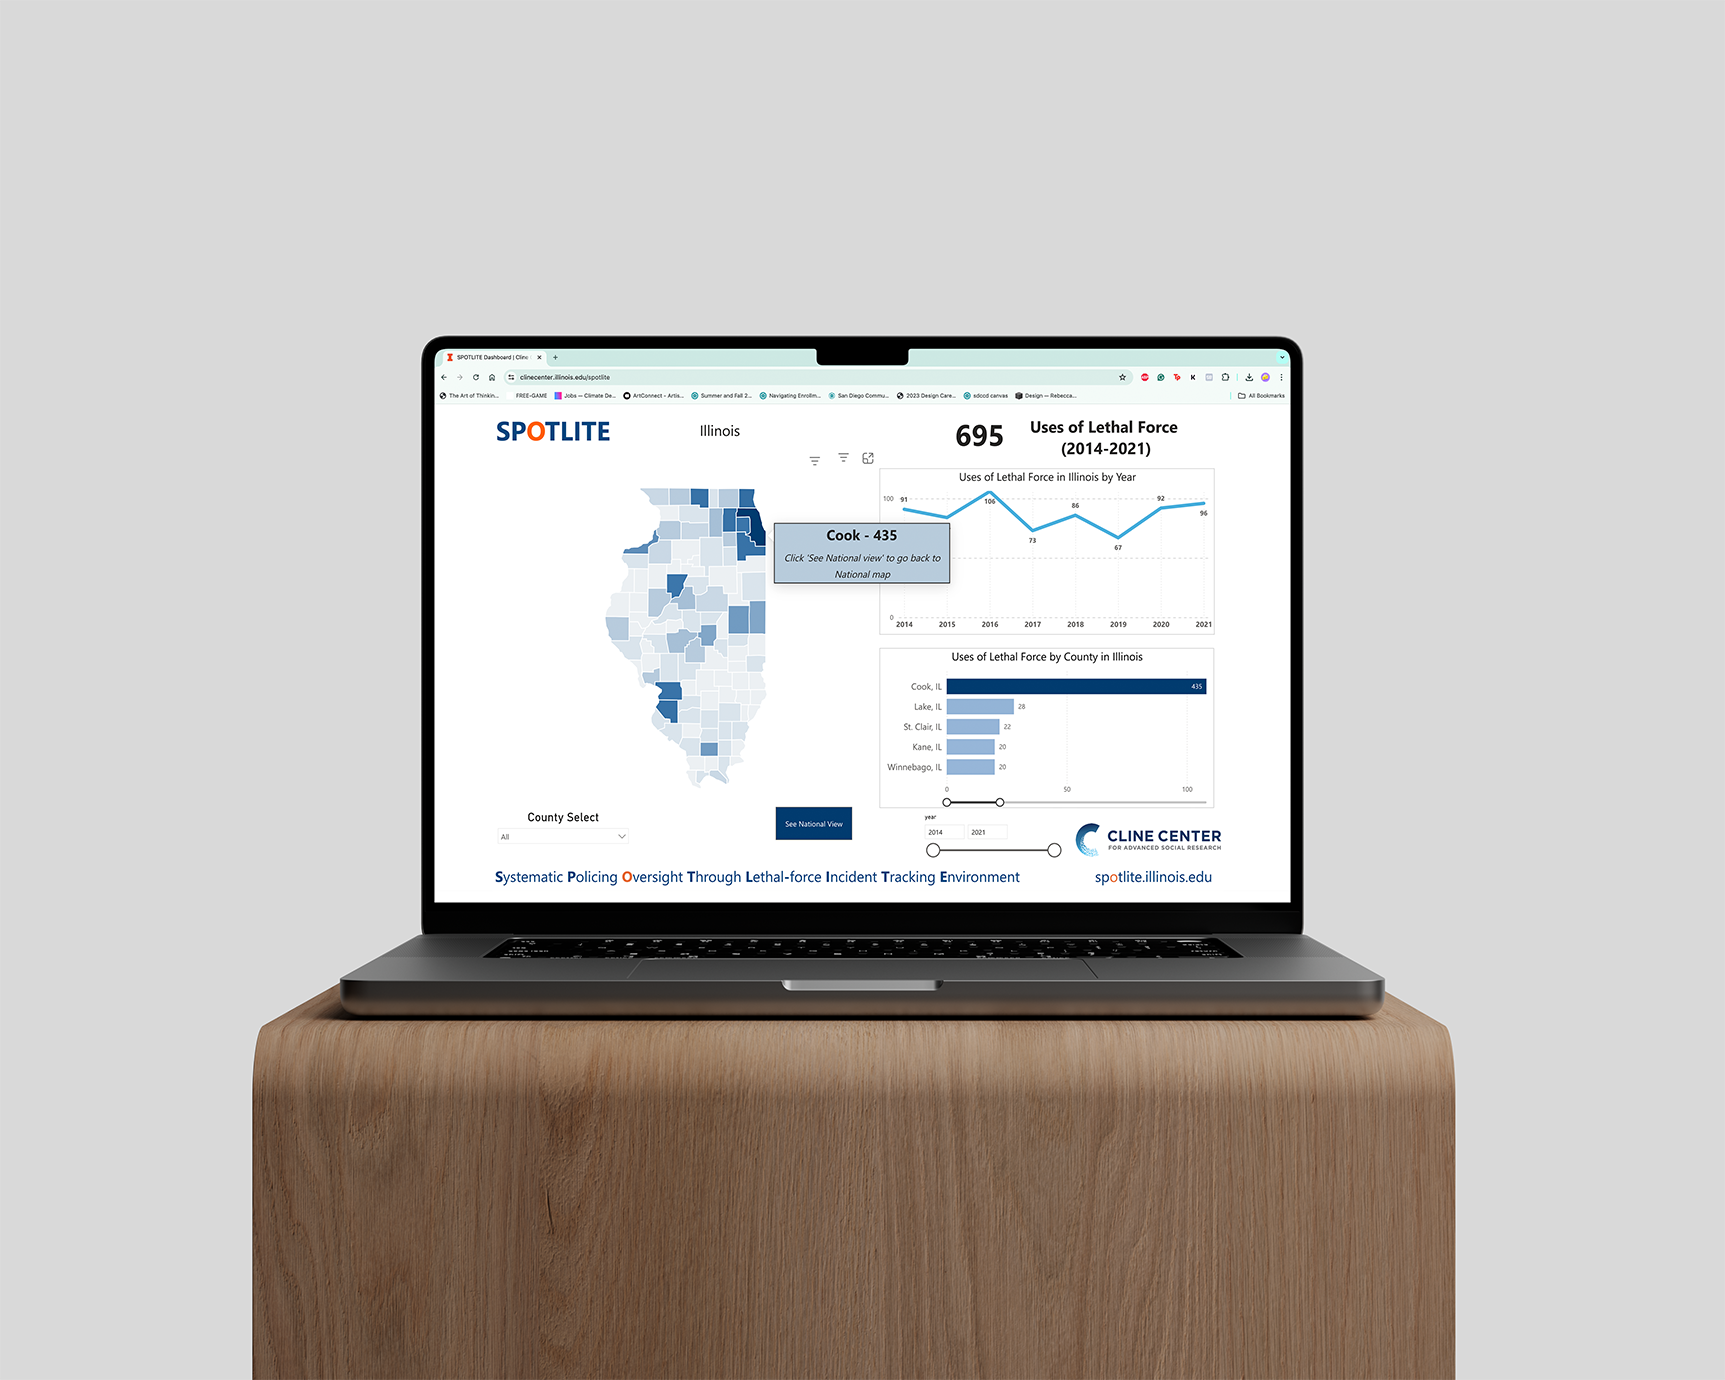
Home Screen Interactive Dashboard: County View
SPOTLITE: Cline Center of Advanced Social Research
Role: User Researcher for HCI & Usability
A nonpartisan, nonadvocacy initiative by the Cline Center, aiming to provide reliable data that facilitates productive conversations about policing in the United States. By continuously releasing new data layers and features, the project offers timely insights into policing trends across the country, with a particular focus on incidents involving police use of lethal force.

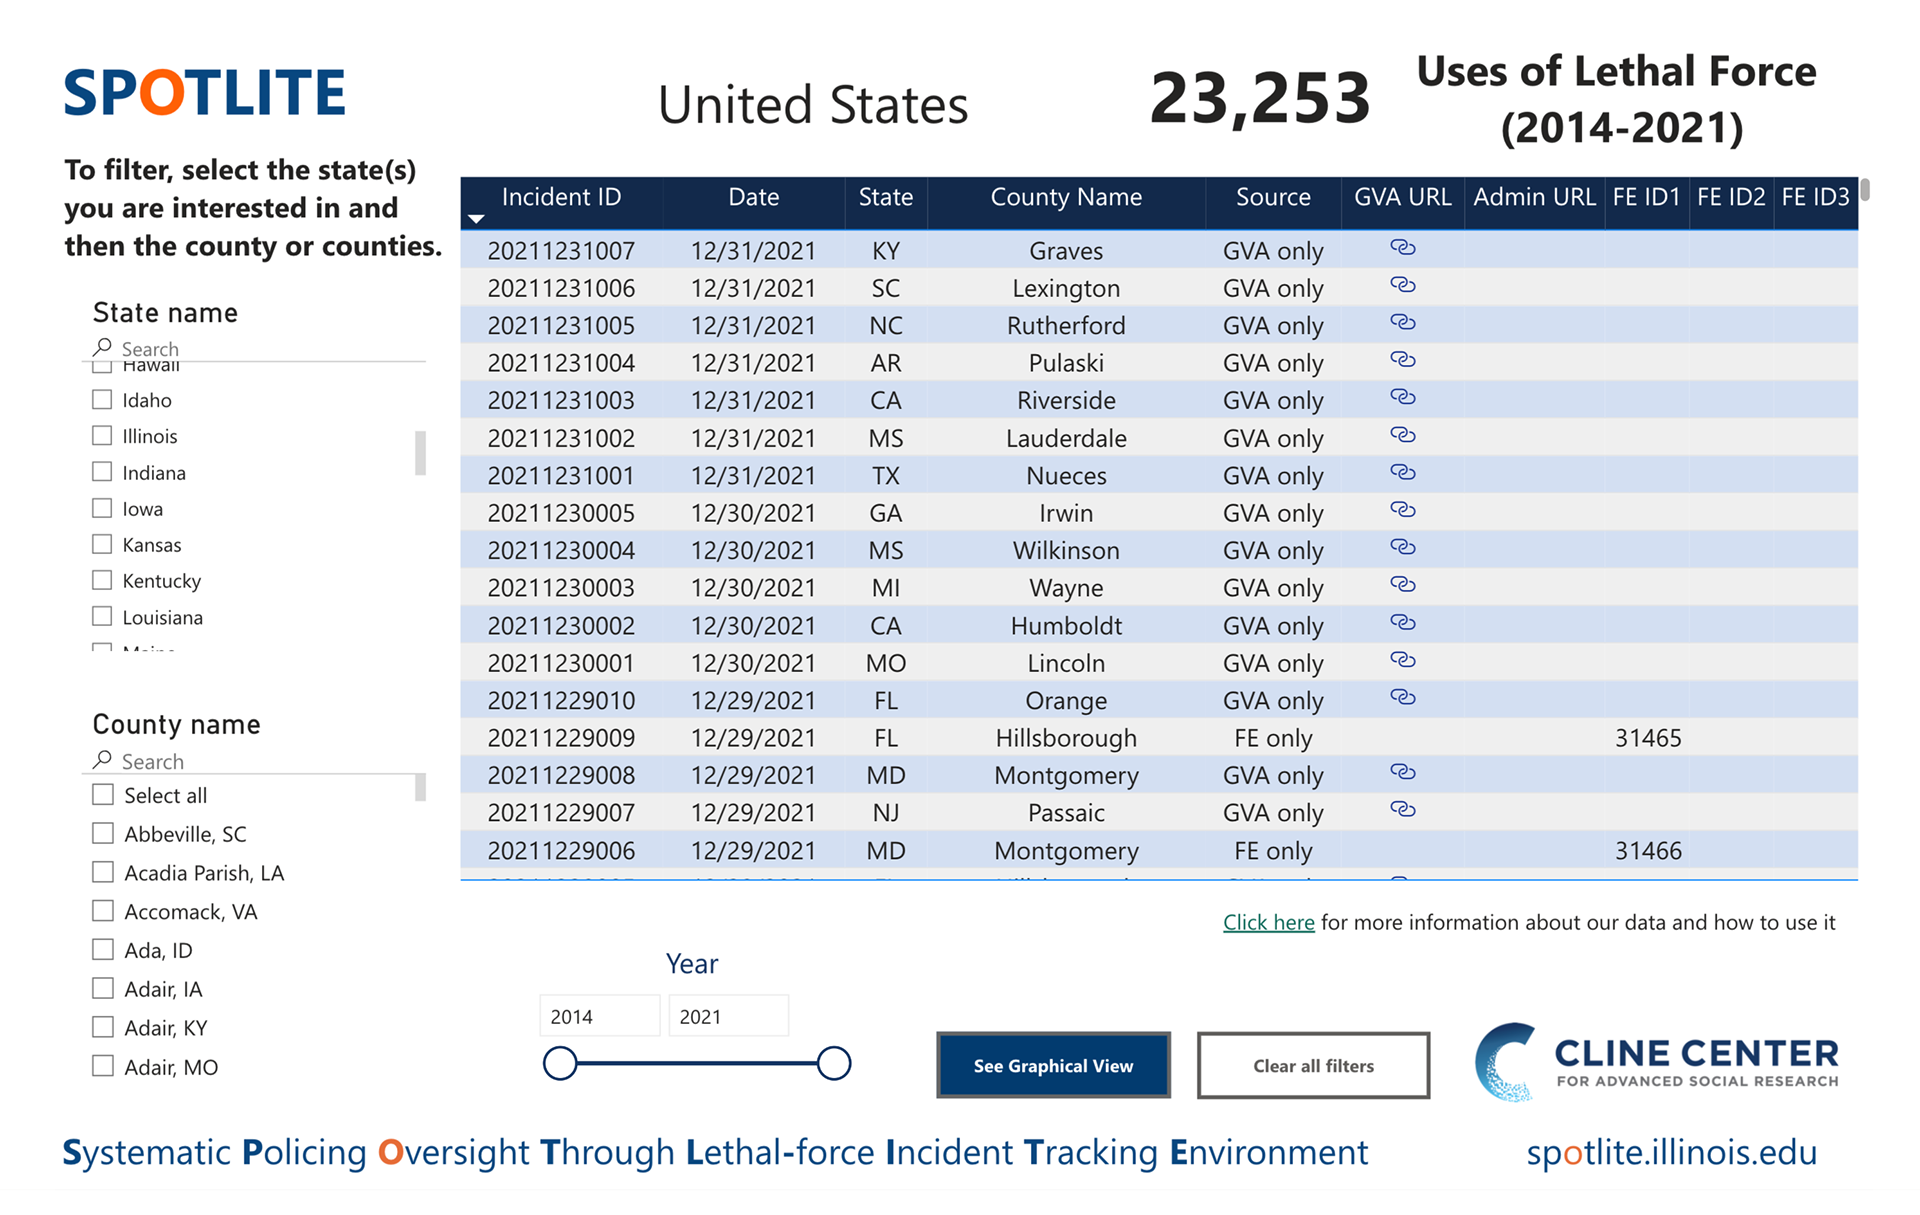
Detailed View Screen

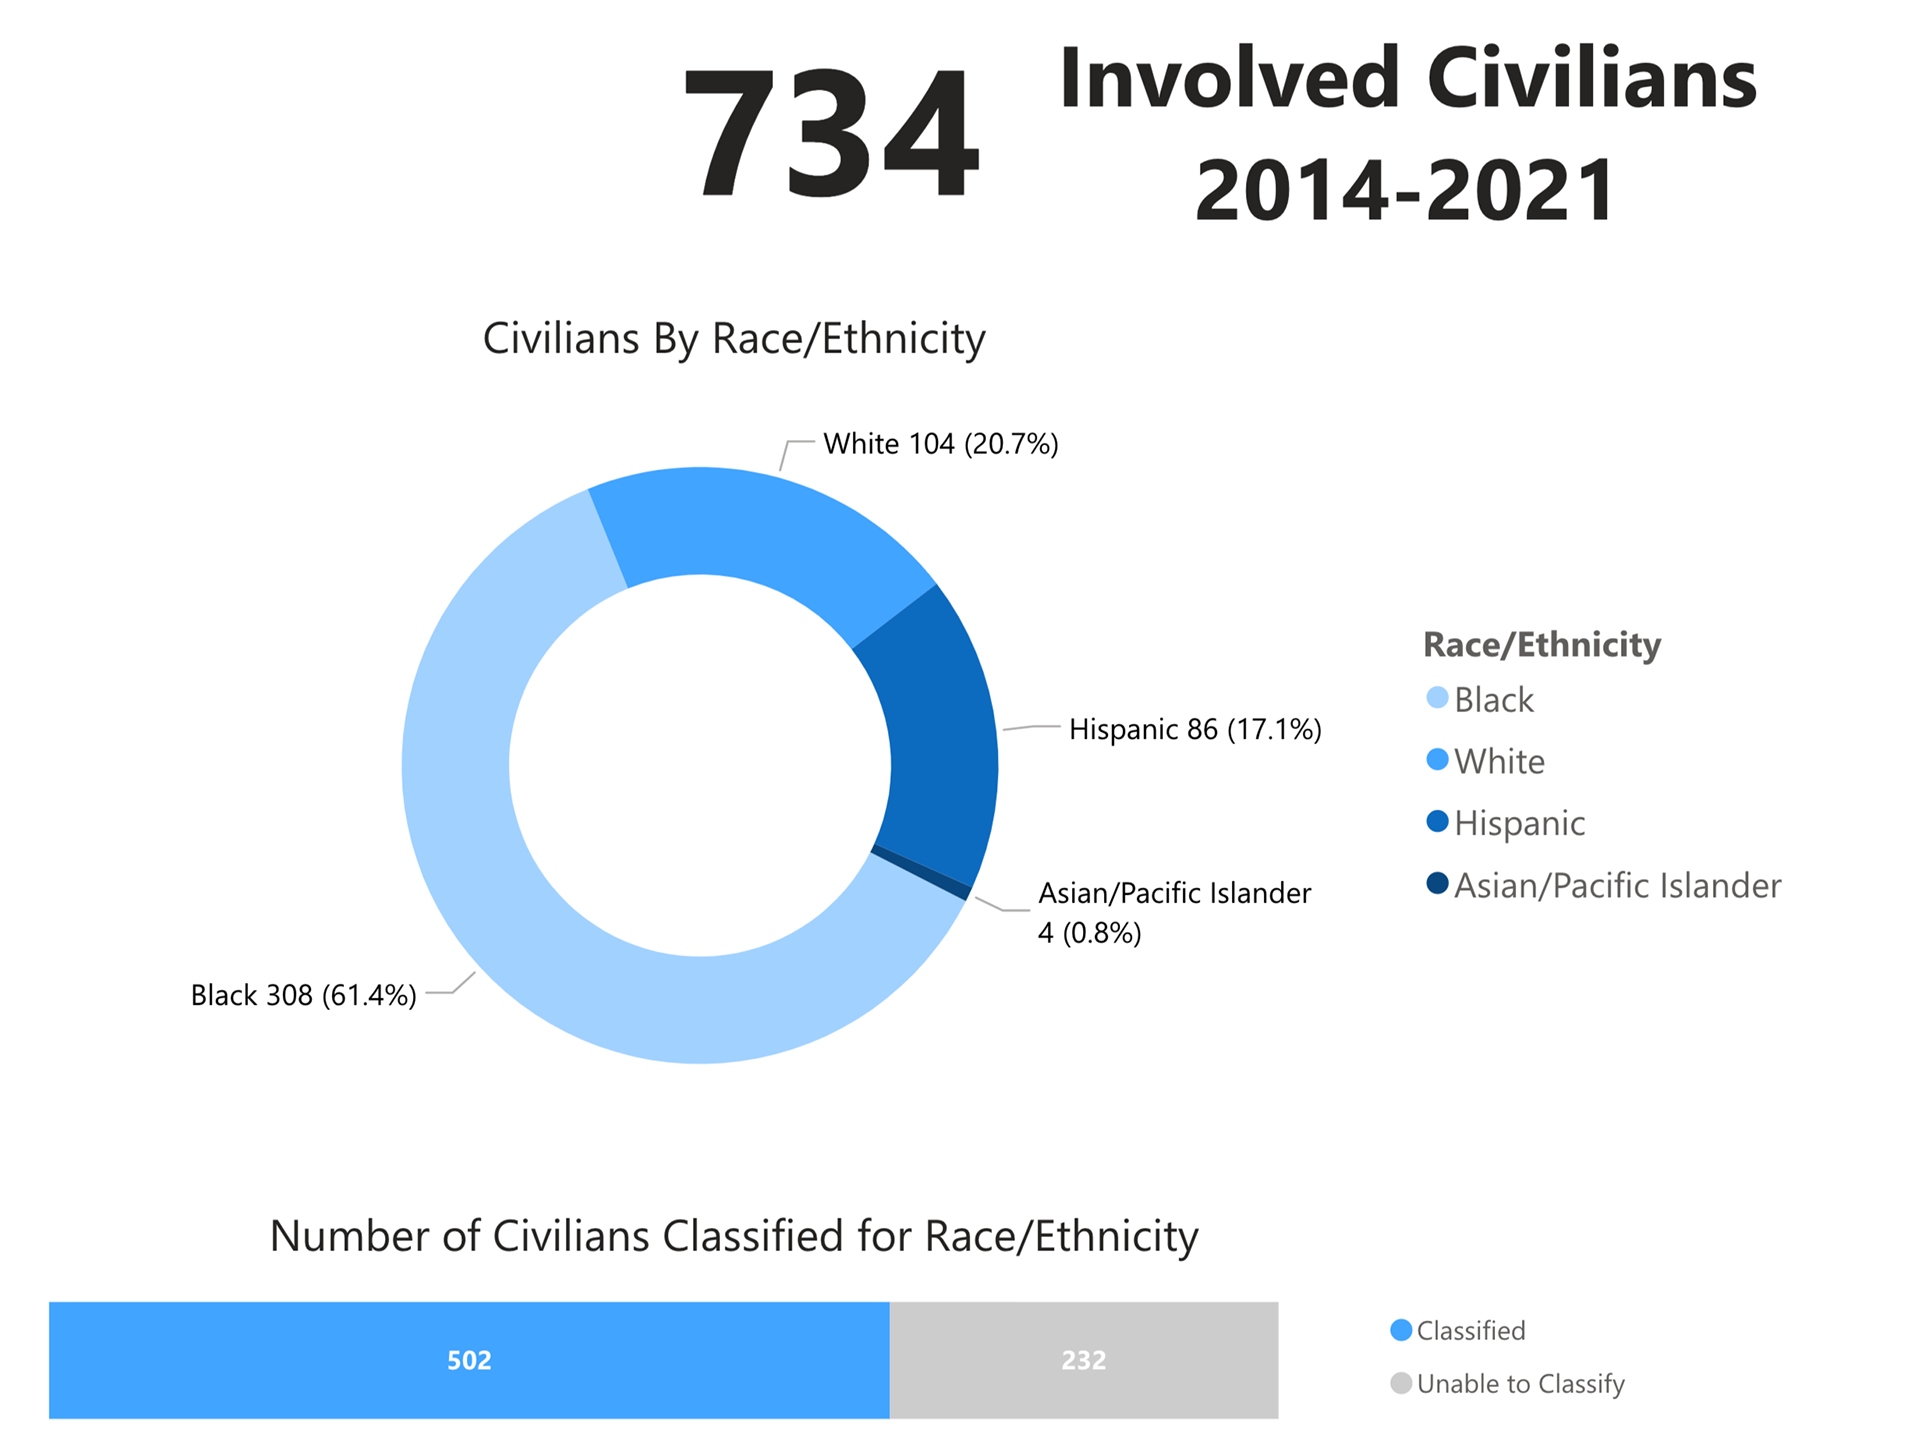
Racial Ethnic Breakdown (Illinois Only)
My Role:
Collaborative Design:
Partnered with researchers and data analysts to conceptualize and design the KPI dashboard for monitoring police use of force incidents.
Partnered with researchers and data analysts to conceptualize and design the KPI dashboard for monitoring police use of force incidents.
User Research & Usability Testing:
Led HCI usability testing through A/B testing to optimize user experience and ensure ease of access to the highest-quality data. Focused on eliminating subjective biases within the user experience.
Led HCI usability testing through A/B testing to optimize user experience and ensure ease of access to the highest-quality data. Focused on eliminating subjective biases within the user experience.
Data-Driven Insights:
Facilitated the integration of key data models that align with SPOTLITE’s mission to provide timely, relevant information about policing trends at the county level.
Facilitated the integration of key data models that align with SPOTLITE’s mission to provide timely, relevant information about policing trends at the county level.
Project Objective:
Design a Key Performance Indicator (KPI) dashboard that visually displays data models of police use of lethal force per county within Illinois. The dashboard would allow users to explore incidents by county, providing an intuitive and actionable tool for policymakers, researchers, and the general public.
Design a Key Performance Indicator (KPI) dashboard that visually displays data models of police use of lethal force per county within Illinois. The dashboard would allow users to explore incidents by county, providing an intuitive and actionable tool for policymakers, researchers, and the general public.

